Summary
- Coral Monitoring: Start date 21st April 2015; Duration: 20 weeks
- Dredging: Start date 29th April 2015; Duration: 19 weeks
- The dials are status on 25th September 2015 with an average of 22.5 bleaching at Impact sites (24% on 8/9/15) and 17% bleaching (16% on 8/9/15) at Control sites
- Dredging Locations: Dredge worked off Fogafale adjacent to:
- Borrow Pit 2 : 29 April-7 July
- Borrow Pit 4 : 7-13 July
- Borrow Pit 7 : 13th July-17 August (including trucking of fill to BP 6 and BP 9)
- Borrow Pit 1 : 22nd August-11th September
- Borrow Pit 10 : 16th-23rd September (the end of dredging).
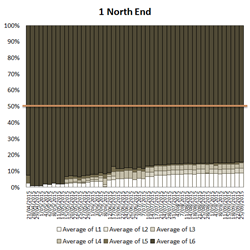
- Coral bleaching continued to be below trigger levels (50% bleaching C1-C5 averaged over all corals)
- The dredge has now stopped operations, and on-going monitoring is needed to document any recovery of bleaching levels. This is of particular interest since the Government has proposed restarting the dredge to obtain some additional materials over the next few weeks. In that case monitoring should continue during the additional dredging and for several months afterwards.
Results 11-25 September
The dredge is now stationed off the coast near the hospital awaiting further works at the request of the Government. At the time of the last dredging on this project the impact sites were considered to be at 2 Tegako Jetty and 3 Catalina Patch with the two most remote sites at the north and south ends acting as relative controls.
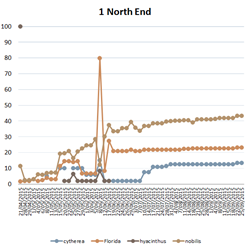
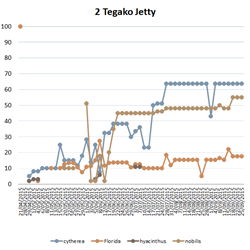
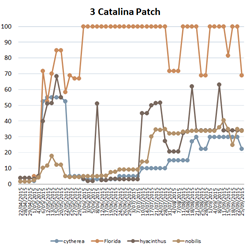
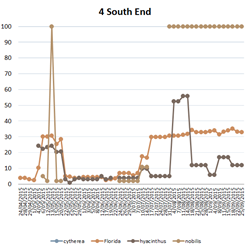
In the dials above levels of bleaching are a few points higher at impact than at control sites (22.5% versus 17%). Most of this difference appears to be related to a high level of bleaching found at 3 Catalina Patch since the start of the project. Over the past month there may have been signs of a decrease in bleaching at the impact sites (overall bleaching was 24% on 8th September), but the change is small and difficult to separate from background variation. Further monitoring over the next few weeks will provide more information. Figures 1 and 2 show that bleaching has been levelling out over the past 2 months at all sites, except for a gradual increase in Acropora hyacinthus at 1 North End and some signs of overall improvement at 3 Catalina Patch Reef.
Conclusions
All of the indicator graphs show that the level of bleaching may be improving since last report. The data suggest that both external factor(s) are causing bleaching that is unrelated to dredging (e.g. the low mid-year tide levels and El Nino effects), and that there is an impact of dredging. Despite the observed changes in coral health, overall average levels of bleaching remained below trigger levels to the end of dredging on 23/9/15. With continued monitoring over the next weeks, depending on whether further dredging commences, we could expect to see recovery.
Figure 1: Levels of bleaching by species and site
Figure 2: Average percentage of all coral surfaces in each level of bleaching (C1-5) and unbleached (C6) at each of the 4 sites. At this time Sites 2 and 3 (Tegako Jetty and Catalina Patch) are closest to the dredging and considered impact sites. Sites 1 and 4 are considered controls. The line shows the 50% trigger.


